About the work
A pie chart in EXCEL for a financial analyst's presentation to management. The chart shows data for the year broken down by month.

A pie chart in EXCEL for a financial analyst's presentation to management. The chart shows data for the year broken down by month.
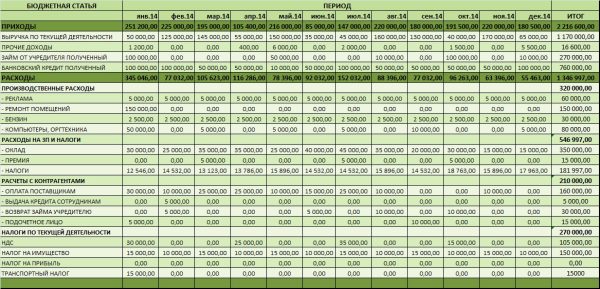 Annual report in EXCEL
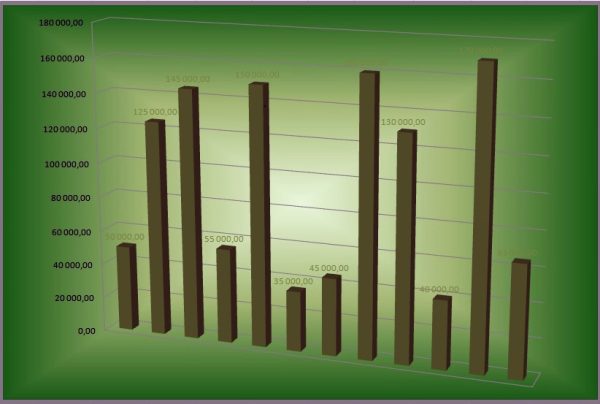 Data in EXCEL as a chart
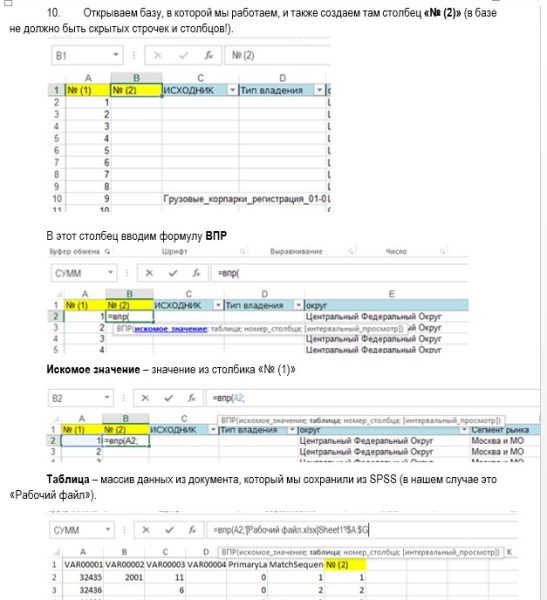 Methodology for optimizing work in Excel using SPSS
 Anna1,358
 Business plan, popcorn sales, vending
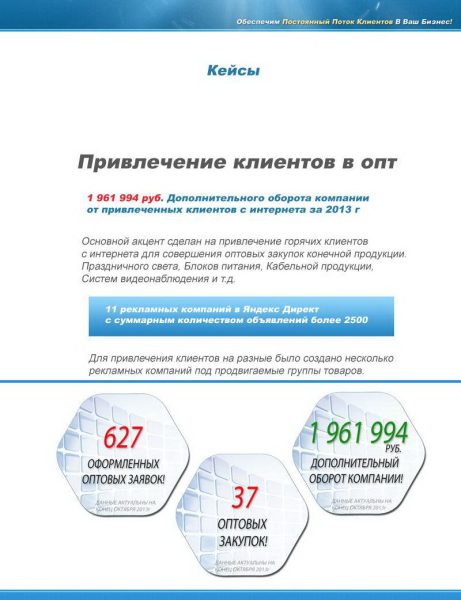 Contextual advertising - attracting wholesale clients
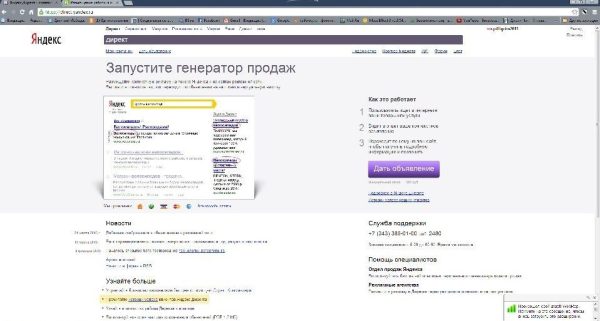 Contextual advertising
 Group "Children's Clothing"
 Denis M.2,160
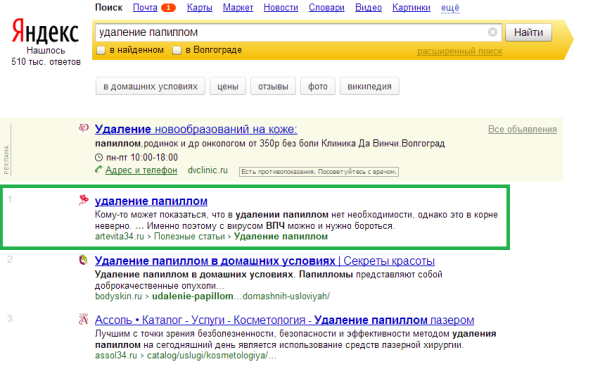 Artevita - cosmetology clinic - Volgograd
 Andrey K.2,137
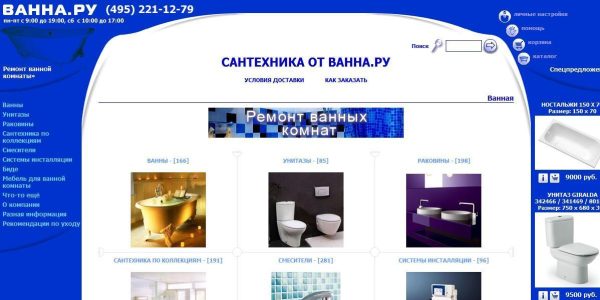 Promotion of a bathroom renovation website
 Dmitry S.2,116
 Company financial model_coffee_vending
